The S.A.F.E. Narrative: Reporting AI Visibility Without Misleading Stakeholders
Key takeaways:
-
AI visibility holds real strategic value, but almost everything about it is probabilistic.
-
Metrics have shifted from deterministic attribution to probabilistic influence.
-
AI visibility reporting should be reoriented toward directional trends, competitive share, and influence.
-
The S.A.F.E. Narrative provides a practical framework for marketers, enabling them to report AI visibility without misleading stakeholders.
Executive Summary (TL;DR): The volatile nature of AI-generated answers, blended platform telemetry, zero-click discovery, traditional attribution models’ breakage, and real user data black boxes forced a shift from deterministic to probabilistic measurements in AI search reporting. Marketers should treat visibility as directional influence, rather than deterministic impact, and report with layered metrics, explicit confidence labels, and clear methodology disclosure. Conversely, clients should expect their AI SEO company to present transparent, unambiguous, and defensible AI visibility deliverables.
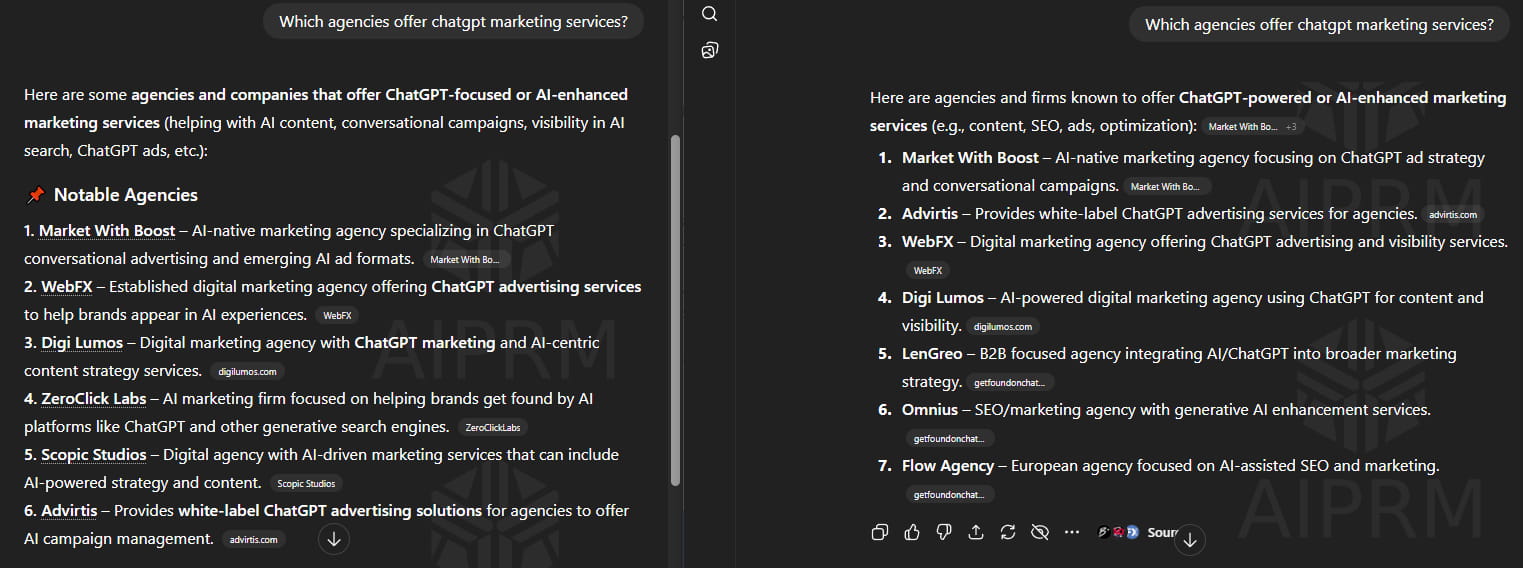
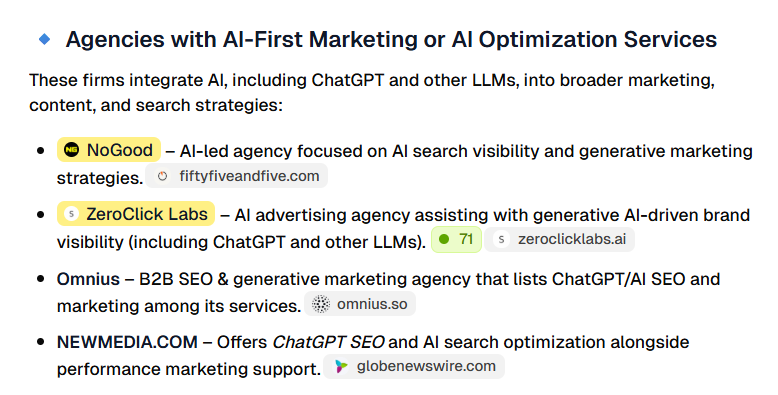
In 2026, AI is the definitive part of the buyer journey. B2B buyers use ChatGPT to discover and shortlist vendors. SaaS buyers increasingly trust GenAI for decision-making. Solutions are surfaced and compared, information analyzed and synthesized, justification documents drafted – all within LLM platforms, all without a single click toward vendor sites.
Executives know this. They still want numbers. That’s where tension begins.
Good old traditional SEO makes things easy for marketers and clients: it has impressions, rankings, click-through rates, and conversion – cold, hard data that can be copy/pasted, presented with minimal interpretation, and still be clear as day.
In contrast, AI visibility reporting has variables, partial signals, proxy indicators, and model opacity – probabilistic measurements that not only need contextual framing, but also responsible reporting so as not to erode the trust between AI SEO service provider and their clients.
How to report AI visibility in 2026 without misleading stakeholders?
Since the metrics have shifted from deterministic attribution to probabilistic influence, AI SEO teams must do the same with their reporting models. Instead of presenting one single metric, they should opt for a layered AI search reporting that clearly distinguishes between hard and inferred metrics.
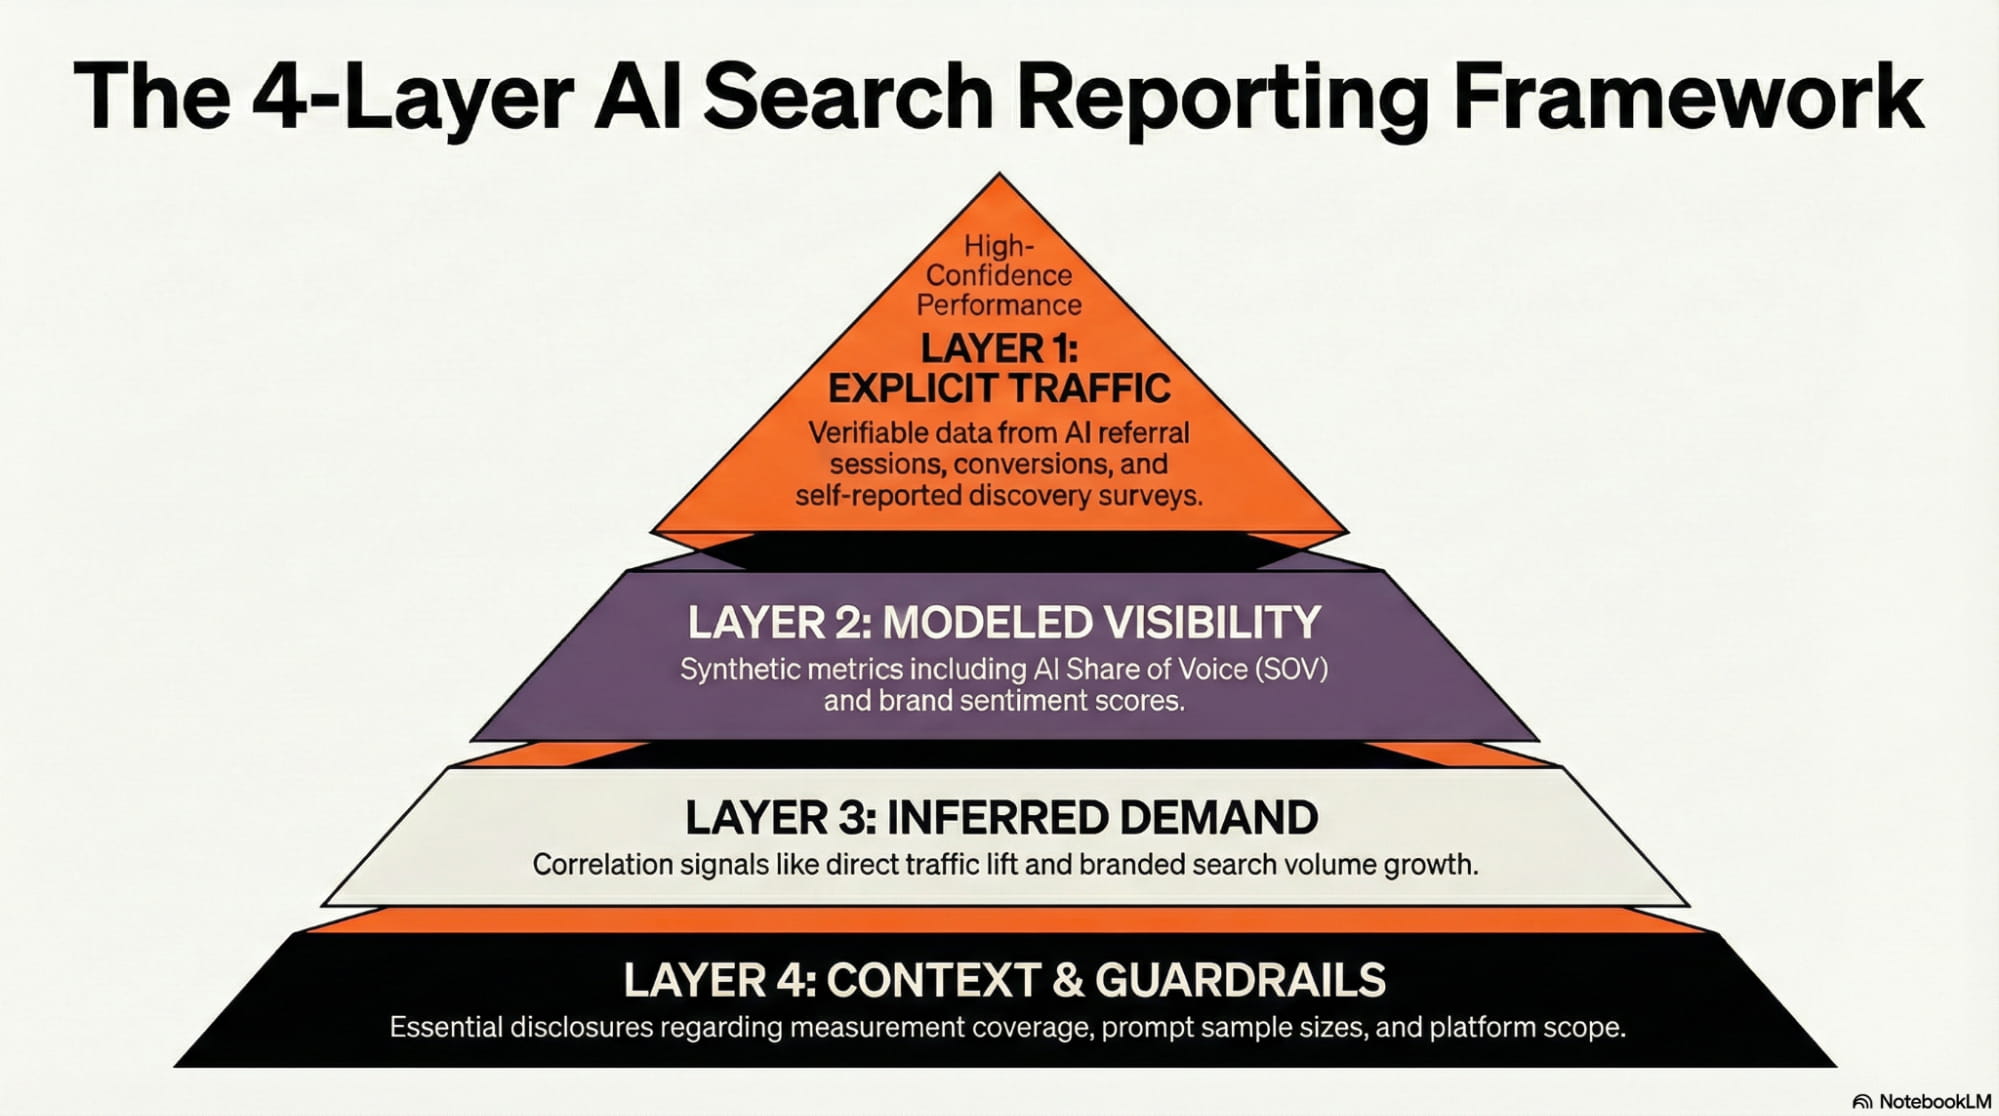
The 4-Layer reporting framework
The 4-Layer framework clearly distinguishes between verifiable, modeled, and inferred data. Each layer is separate in the deck, and each has a clear confidence tag, with the exception of the last, which serves to contextualize the methodology and provide clarity to stakeholders. Separate layers should not be blended into a single KPI, as this can create artificial causation, leading to confusion or misfocusing optimization.
Layer 1: Explicit traffic (Confidence: High)
These are signals that actually can be measured when available, and deliver direct, verifiable data:
- AI referral sessions: The number of sessions originating from identifiable AI domains (chatgpt.com, perplexity.ai, gemini.google.com, etc.), tracked via GA4 Regex.
- AI referral conversion rate: The percentage of sessions that complete a defined goal (e.g., form fill, demo request, purchase);
- AI referral engagement: Post-click behavioral signals from AI-referred visitors, such as bounce rates, time on site, pages per session, etc.
- Declared discovery (self-reported): The percentage of leads or customers who explicitly state (typically through a website survey) they discovered the brand via AI tools;
- AI-cited URLs: The number of unique website page appearances as cited sources in generated responses.
How to present in a report: Numeric lower bound + short explanation of referrer caveats.
Layer 2: Modeled visibility (Confidence: Medium)
Since LLM providers do not release real user query logs, metrics in this layer rely on structured prompt testing and controlled observation, which is why they’re also referred to as “synthetic visibility,” and may include:
- AI Share of Voice (SOV): The percentage of AI responses where a brand is mentioned/cited, compared to competitors.
- Competitive SOV gap: The difference in SOV between the brand and primary competitors.
- AI citation frequency: The average number of times the brand is cited per synthetic prompt set.
- AI sentiment score: The proportion of positive, negative, and neutral mentions within a response set.
- AI hallucination rate: The percentage of generated responses that contain factually inaccurate information.
- NOTE: This can also pertain to outdated and not just AI-fabricated information.
- Brand framing consistency: The degree to which AI positions the brand as-intended (e.g., “enterprise CRM platform” vs. “SMB CRM tool”)
- Answer position presence: Brand positioning within AI-generated response (i.e., primary source/recommendation vs. secondary mention).
Layer 3: Inferred demand (Confidence: Low)
Due to the zero-click nature of AI search, dark traffic, and a fragmented user journey, last-click attribution often fails for AI responses. Therefore, marketers must resort to signal correlation to infer the AI impact:
- Direct traffic lift: The increase in visits to the brand website pages specifically optimized for AI “appeal.”
- Branded search volume growth: Sudden uplift in lagging indicators, potentially influenced by AI exposure.
- Multi-touch attribution: Informational page visits followed by delayed conversion.
- Assisted conversion trends: Time-shifted conversions (sometimes by weeks), preceded by AI-influenced page appearance earlier in the buyer journey.
- High-intent page traffic growth: Surges in traffic to commercial or comparison pages that match AI prompt themes.
Layer 4: Context, Guardrails, Constraints
These are not performance/visibility metrics but, rather, transparency metrics that should accompany every report for clarity and credibility:
- Measurement coverage disclosure: A statement clarifying what percentage of AI visibility is directly measured vs. modeled vs. inferred.
- Prompt sample size: The number of prompts used in synthetic testing to calculate SOV or citation frequency.
- Testing frequency: How often was synthetic testing conducted (e.g., weekly, bi-weekly, monthly, quarterly).
- Platform scope: Which AI platforms were included in testing.
Attribution limitation statement: A documented clarification that zero-click AI exposure cannot currently be measured.
What NOT to include in AI search reporting?
AI rankings, prompt search volume, and zero-click attribution – should NOT be reported. These “metrics” are either highly misleading or not metrics at all and, as such, are considered common “reporting traps” that can erode credibility when data is scrutinized.
Do NOT report “AI Rankings”
Why? Because they don’t exist – i.e., there’s no static “Position #1 in ChatGPT” as there is in traditional SERPs (e.g., “Rank #1 in Google”). AI answers are generated dynamically and can vary based on search history, context, user location, and a variety of other criteria, making them highly inconsistent. Even the exact same prompt yields different outputs more than 50% of the time, making traditional rank-tracking obsolete in zero-click environments. Instead: Focus on citation frequency or presence rate (e.g., “The brand appears in 60% of relevant queries”).
Caveat: Understandably, clients love to see their brand name mentioned in AI responses, so reporting on specific brand mentions is often necessary. For transparency’s sake, it’s best to include a disclaimer about the inconsistency of AI responses and focus on monitoring brand mentions in the same prompt responses over a longer time period.
Do NOT invent “Prompt Search Volume”
Why? Because it doesn’t exist – LLM providers do not release real-user data, so it’s impossible to measure how many people entered a specific prompt. Consequently, results from third-party tools should be taken with a great dose of caution, as the “AI Volume” they claim to show is often just an educated guess based on standard Google search volume or limited clickstream panels.
Instead: Focus on relevance and category ownership (e.g., “We are the dominant citation for XYZ queries”).
Do NOT claim zero-click attribution
Why? Because it cannot be tracked, unless self-reported. The vast majority (93%) of AI searches end without a click, evading standard tracking channels entirely. Therefore, claiming revenue from these search sessions without the explicit declared discovery is pure fabrication.
Instead: Include attribution limitation statement in AI visibility deliverables.
The S.A.F.E. narrative framework
Reporting AI visibility in 2026 without misleading stakeholders is not just about honesty, transparency, and industry-aligned terminology, but also about bridging the gap between traditional SEO metrics and the probabilistic nature of AI engines. The S.A.F.E. framework is a practical, quick-reference tool that helps ensure credibility in an ecosystem where precision is limited – but accountability is not.
Table 1: S.A.F.E. framework
S
Separate:
“Visibility” from “Impact”
“Measured” vs. “Modeled”
Why: In AI search, visibility does NOT always equal value.
Solution: Separate top-of-funnel visibility from bottom-of-funnel impact.
Why: Different KPIs should not be blended, as they can create artificial causation, leading to stakeholder confusion.Solution: Clearly separate deterministic (hard, measurable data) and probabilistic measurements (modeled/inferred data).
A
Avoid:
Fabricated precision
“Floating” metrics
Why: Presenting numbers with many decimals or exact percentages when the underlying data is estimated, sampled, or noisy creates “false precision”, which can mislead decision-makers into over-optimizing toward wrong signals.
Solution: Report confidence ranges (e.g., 40% ± 5pp) or rounded figures (e.g., ~40%) rather than the exact number (e.g., 37.524%) and always display sample size and method.
Why: Isolated metrics can be misleading and look like exaggeration, thereby eroding credibility.Solution: Anchor AI search visibility metrics to something concrete (e.g., AI SOV → Competitive SOV; AI brand mentions → Category coverage)
F
Focus on:
Directional trends & competitive share
Influence, not attribution
Why: Fixed rankings cannot be tracked across AI platforms. Focusing on longitudinal trends “smooths” out the randomness of AI responses, providing a relatively reliable gauge of market ownership. Prioritizing position relative to competitors over single-point, absolute counts is typically more actionable, since it normalizes for query volume and seasonality.
Solution: Use rolling windows (7/30/90 days) and present WoW and QoQ trends; track competitive share metrics, normalized for query volume and seasonality (index to baseline period); highlight leading and lagging indicators.
Why: AI platforms are upstream discovery layers that influence decisions, but seldom close attribution loops.Solution: Only claim attribution if the results can be directly verified. Otherwise, label them as directional influence.
E
Explain:
Uncertainty & why it matters
Methodology (synthetic testing)
Why: Stakeholders don’t hate uncertainty. They hate hidden uncertainty. Openly communicating data limitations and admitting industry-wide blind spots establishes credibility and a healthy reporting culture.
Solution: Explicitly list sources and magnitude of uncertainty; Annotate reports with clear caveats (e.g., “why this matters”, “what assumptions underlie this report”).
Why: Without methodological disclosure, SOV appears arbitrary.Solution: Disclose the testing framework (i.e., sampling, categorization, controls, frequency) to anchor modeled metrics.
AI visibility deliverables: What should clients expect from their marketers?
In high-stakes, fast-moving environments such as B2B, results matter – but how they are presented matters just as much. In many cases, clients lose confidence in their AI SEO agencies not because the results were lacking, but because they were difficult to interpret or weren’t immediately visible. While data dumps can rarely be avoided, information can be presented in a clear, transparent, defensible, and unambiguous manner – despite the algorithmic volatility of LLMs.
Table 2: AI visibility deliverables
| Category | Deliverables |
| Measured Performance (Verified) | AI referral traffic reportAI referral conversion summaryAI referral revenue (only where & if attributable)AI referral engagement metricsDeclared AI discovery survey summaryAI-cited URL inventory |
| AI SOV & Citations (Sampled) | AI Share of Voice (Prompt Sample-Based)Competitive Share of Voice comparisonCitation frequency analysisPrompt coverage by intent clusterPlatform-specific visibility snapshot (e.g., ChatGPT, Gemini, Perplexity)Monthly/quarterly SOV trend report |
| Brand Representation & Risk Monitoring | AI sentiment summaryBrand framing analysisHallucination detection reportMisinformation flag logCompetitive framing comparison |
| Influence & Trends (Directional) | Assisted conversion trend summaryHigh-intent page traffic trendsAI-optimized page performance overviewBranded search trend correlationAI-influenced traffic model (clearly labeled as inferred) |
| Content & Optimization Impact | AI-optimized page visibility changesCitation gains/losses reportStructured data implementation impactEntity expansion impact overviewCommercial prompt visibility improvements |
| Competitive Share | Competitive AI visibility benchmarkCategory-level AI presence mappingCompetitor citation advantage/gap analysisEmerging competitor detection in AI responses |
| Transparency & Methodology (Disclosure) | Prompt sample size disclosureTesting methodology summaryMeasurement coverage statementPlatform limitations disclosureAttribution constraints statement |
| Executive Summary (Interpretation-friendly) | AI visibility executive brief (SAFE-aligned)Key wins & risk areas summaryDirectional business impact commentaryRecommended next actionsConfidence-level labeling (measured vs modeled vs inferred) |
| Optional AI visibility deliverables (for advanced/technical clients) | AI visibility maturity assessmentAI governance & risk framework summaryAI crisis monitoring snapshotAI competitive opportunity mapAI optimization roadmap (quarterly planning view) |
Visibility or Clarity? Why Not – Both?
Visibility without clarity = noise. Clarity without visibility = stagnation. You deserve the best of both worlds.
With discovery moving upstream, visibility expanding faster than measurements can keep up, and last-click attribution fundamentally broken, the real advantage in 2026 is not just being cited by generative engines – it’s drawing actionable insights, despite the data obscurity.
As your partner, ZeroClick Labs delivers on both fronts: improving your presence within AI-platforms AND translating probabilistic signals into clear, defensible data – both critical for the success in zero-click environments.
“Our agency had no idea how to approach AI visibility. ZeroClick only does this one thing so they actually know what works. Worth every penny just to not waste time figuring it out ourselves.” – Jay